Protocol handler debugging in Dynamics GP (drill down) problems
In previous blog posts we have talked about the way that other applications can drill down into parts of GP by using an direct approach via a pluggable protocol handler that is installed when GP is installed. Sometimes this does not work, to debug if the protocol handler has an end point to talk to follow these instructions.
Get Handle.exe
Download Handle.exe which is part of the SysInternals tools that Microsoft acquired some time back, written by Mark Russinovich,
https://docs.microsoft.com/en-us/sysinternals/downloads/handle
Extract the Zip file, if you have 64 bit system use the 64 bit version, otherwise use the plain version.
Use PowerShell to pipe out and decode handle.exe output
Open a PowerShell editor on your machine (e.g. start menu, search powershell, launch Windows PowerShell ISE)
In my case I extracted the handles.exe into the C:\Users\tw\Documents\ folder, you will need to change the path for where you extracted it to…
Execute the following PowerShell Command:
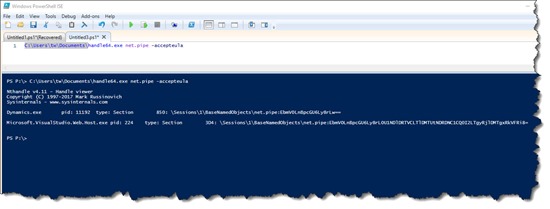
C:\Users\tw\Documents\handle64.exe net.pipe -accepteula
This will accept the user agreement and pipe the output of the handle viewer to powershell for decoding.
This gives the following output.
You can see that visual studio and Dynamics.exe have named pipes running.
If I close Dynamics GP, then run it again…
You see that Dynamics .exe is not listed as having named pipes available anymore as it is closed.
[System.Text.Encoding]::UTF8.GetString([Convert]::FromBase64String("bmV0LnBpcGU6Ly8rLw=="))
net.pipe://+/
Using powershell to list all
[System.IO.Directory]::GetFiles("\\.\\pipe\\")


