Dynamics GP drill down logging to trace file for diagnosing problems
In a previous posts I’ve looked that protocol handler used to create the drill down features in reports and other applications used with Dynamics GP.
Asynchronous pluggable Protocol Handler for Dynamics GP (for drilldown/drillback)
Dynamics GP Drill Down Protocol Handler error
-in those posts, I investigated the debug switches that can be added to the protocol handler’s configuration file and showed some of the various errors that can be generated from Dynamics GP drill down.
The configuration file for the Dynamics GP protocol handler can normally be found here:
\Program Files (x86)\Common Files\Microsoft Shared\Dexterity\Microsoft.Dynamics.GP.ProtocolHandler.exe.config
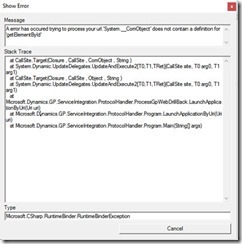
Adding these switches to the above file will cause a dialog box to pop when errors occur, that the user can then screen shot and pass to you.
<add key="DebugMode" value="true" />
<add key="UseWindowsEventLog" value="true" />
<add key="UseLogFile" value="true" />
Example of error window generated after applying these switches:

Logging Dynamics GP Drill down errors to trace file
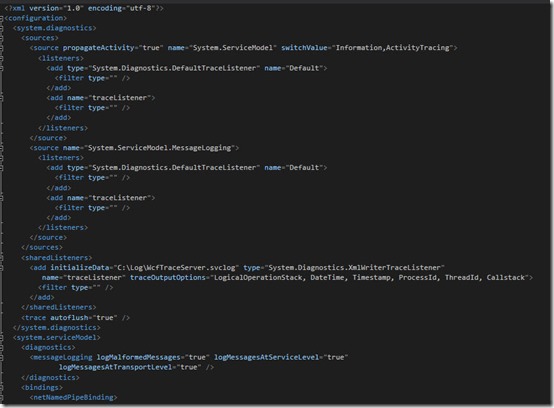
However WCF, the underlying enabling technology that the protocol handler is utilising to talk to GP, allows us to log activity to a log file that can be analysed too. To utilise this, change the configuration file to look like the following. Then create a C:\log folder for the log file to go to, or change the location in the line:
<add initializeData="C:\Log\WcfTraceServer.svclog"
The detail of the logging and what is logged can be changed with different settings in this XML. This example gets you going without learning detail of WCF, which is beyond the scope of this post.

Now when an exception occurs the file will be generated in the folder:

Using the Service Trace Viewer Tool
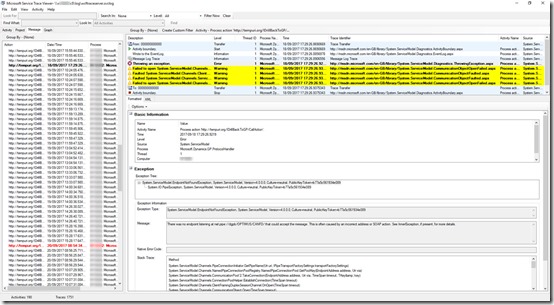
This file is an xml file that is difficult to read and understand, however you can use the Service Trace Viewer Tool (SvcTraceViewer.exe) to investigate the file. I have shown an example below. This give a richer environment to investigate errors and allows a less disruptive way of capturing them from the client machine.
Armed with this information from the log file, it is much easier to get an investigate any errors the service may be encountering, errors that otherwise would be hidden from the user and admin. Below is a full configuration file given as an example to show the context of the changes.
The WCF Configuration Editor Tool is my recommended way to edit WCF configuration files, but may be daunting for those who do not have a basic understanding of WCF. Configuration Editor Tool (SvcConfigEditor.exe)
Example of full configuration file:
<?xml version="1.0" encoding="utf-8"?>
<configuration>
  <system.diagnostics>
    <sources>
      <source propagateActivity="true" name="System.ServiceModel" switchValue="Information,ActivityTracing">
        <listeners>
          <add type="System.Diagnostics.DefaultTraceListener" name="Default">
            <filter type="" />
          </add>
          <add name="traceListener">
            <filter type="" />
          </add>
        </listeners>
      </source>
      <source name="System.ServiceModel.MessageLogging">
        <listeners>
          <add type="System.Diagnostics.DefaultTraceListener" name="Default">
            <filter type="" />
          </add>
          <add name="traceListener">
            <filter type="" />
          </add>
        </listeners>
      </source>
    </sources>
    <sharedListeners>
      <add initializeData="C:\Log\WcfTraceServer.svclog" type="System.Diagnostics.XmlWriterTraceListener"
         name="traceListener" traceOutputOptions="LogicalOperationStack, DateTime, Timestamp, ProcessId, ThreadId, Callstack">
        <filter type="" />
      </add>
    </sharedListeners>
    <trace autoflush="true" />
  </system.diagnostics>
  <system.serviceModel>
    <diagnostics>
      <messageLogging logMalformedMessages="true" logMessagesAtServiceLevel="true"
             logMessagesAtTransportLevel="true" />
    </diagnostics>
    <bindings>
      <netNamedPipeBinding>
        <binding name="NetNamedPipeBinding_IDrillBackToGP" closeTimeout="00:01:00"
          openTimeout="00:01:00" receiveTimeout="00:10:00" sendTimeout="00:01:00"
          transactionFlow="false" transferMode="Buffered" transactionProtocol="OleTransactions"
          hostNameComparisonMode="StrongWildcard" maxBufferPoolSize="524288"
          maxBufferSize="65536" maxConnections="10" maxReceivedMessageSize="65536">
          <readerQuotas maxDepth="32" maxStringContentLength="8192" maxArrayLength="16384"
            maxBytesPerRead="4096" maxNameTableCharCount="16384" />
          <security mode="Transport">
            <transport protectionLevel="EncryptAndSign" />
          </security>
        </binding>
      </netNamedPipeBinding>
    </bindings>
    <client>
      <endpoint address="net.pipe://dynamicsgpdrillback/" binding="netNamedPipeBinding"
             bindingConfiguration="NetNamedPipeBinding_IDrillBackToGP"
             contract="DynamicsGPDrillBackService.IDrillBackToGP" name="NetNamedPipeBinding_IDrillBackToGP" />
    </client>
  </system.serviceModel>
  <appSettings>
    <!-- String value, please use good file system notation (i.e. "c:\Dynamics\GP\DynamicsGPDrillBack.xml") -->
    <add key="BindingName" value="NetNamedPipeBinding_IDrillBackToGP" />
    <!-- Boolean values only (true/false) -->
    <add key="DebugMode" value="true" />
    <add key="UseWindowsEventLog" value="true" />
    <add key="UseLogFile" value="true" />
  </appSettings>
</configuration>


