Check for User Messages(1) Dynamics GP Process Monitor
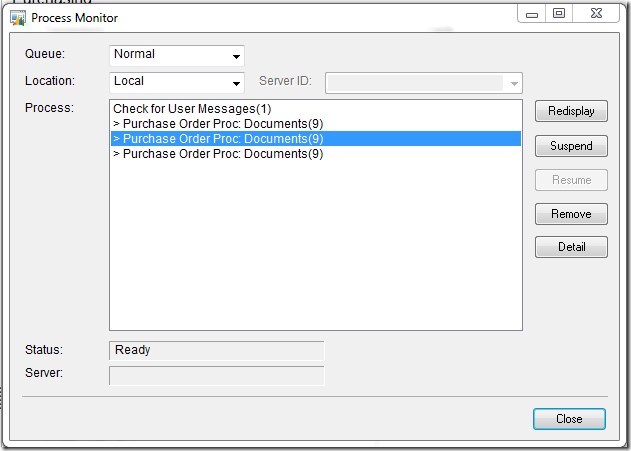
Since GP 2013 sometimes when checking in the GP process monitor, (Microsoft Dynamics GP>> Process Monitor), the message “Check for User Messages(1)” may be found in the process queue.
The origin of this message is a new feature of GP that allows administrators to send messages to GP users. These messages pop-up on the users’ screens after a short delay.
This is achieved through the existence of a polling process that runs regularly on each client instance. That polling process checks for any messages waiting to display to the user. It is this process waiting in the queue that shows up as “Check for User Messages(1)”.
It will keep adding itself to the process queue, after running check links or similar very long processes, I’ve seen dozens of these all stacked up awaiting processing. These processes quickly pop off the queue and disappear, once it reaches the top of the queue.
See below process monitor screen shot for an example of stuck processes:
Send User Message Functionality
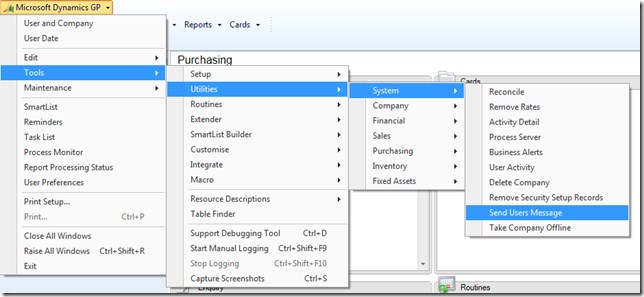
The new message functionality is found under:
Microsoft Dynamics GP>> Tools>> Utilities >> System>> Send Users Message
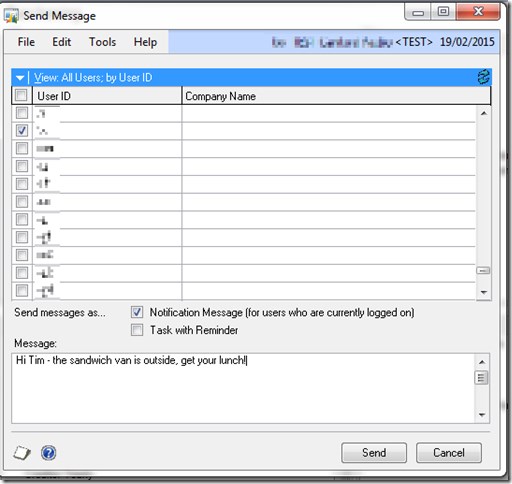
The user is selected, and message entered.
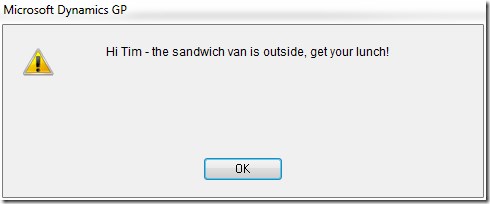
That after around 30 seconds or so results in the following on the user’s screen.
Obviously this process is polling a table in the DYNAMICS database. The table is SY30000 and the message is put in the “Offline_Message” field, see below where the message to me is “test”.
Stuck Process Queue
If the process queue gets stuck (crashes) it will no longer process queued jobs, however the “check for user messages” process continues to be added to the queue every min or so. As the queue has crashed and is no longer removing items, it just builds, filling up with this process. What is seen as a result is this process swamping the queue.
As the “check for user messages” process is the most frequent process to be added to the queue, it therefore becomes the most likely process to be added immediately after any crash occurs in the queue. This makes it appear, when looking at the process monitor, like the “check for user messages” caused the problem, however it is merely a victim. The actual process responsible was whichever process immediately preceded it in the queue, as that was the item that caused the queue to halt.
Investigation of the reason why that previous process crashed can be done by checking SQL logs, switching logging on in GP (use the Support Debugging tool), using SQL profiler, changing reports for unmodified vanilla ones if they have been changed etc. This is really a different subject and I’d encourage you to involve a GP consultant as instigations can be arduous.
Shortcut
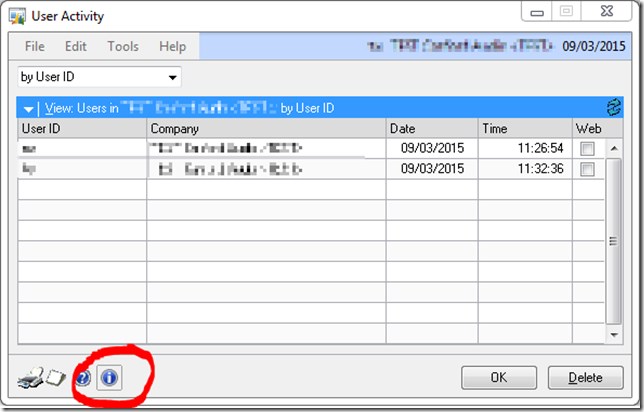
I’ve just noted that the “i” button on User Activity window, Microsoft Dynamics GP>> Tools>>Utilities>>System>>User Activity, shown blow also short cuts to send a message window too.

